Virtual solar PPA in Sweden

Accelerating the transition to 100% renewable energy while hedging against volatile electricity prices

Through a virtual PPA (vPPA) from a new solar park, the difference between the market spot price and the solar PPA price becomes your value. You’re adding green energy to the grid while at the same time hedging against fluctuations in electricity spot prices. Win win.

Since a vPPA is a financial instrument, it doesn’t have to change how you procure power at all – you can simply continue to pay for electricity just like you’ve always done. You will own the Guarantees of Origin (GOs) generated by the solar park, so you can buy less GOs from the market. You may also choose to do less hedging of your electricity supply, since the vPPA is a hedge in itself.

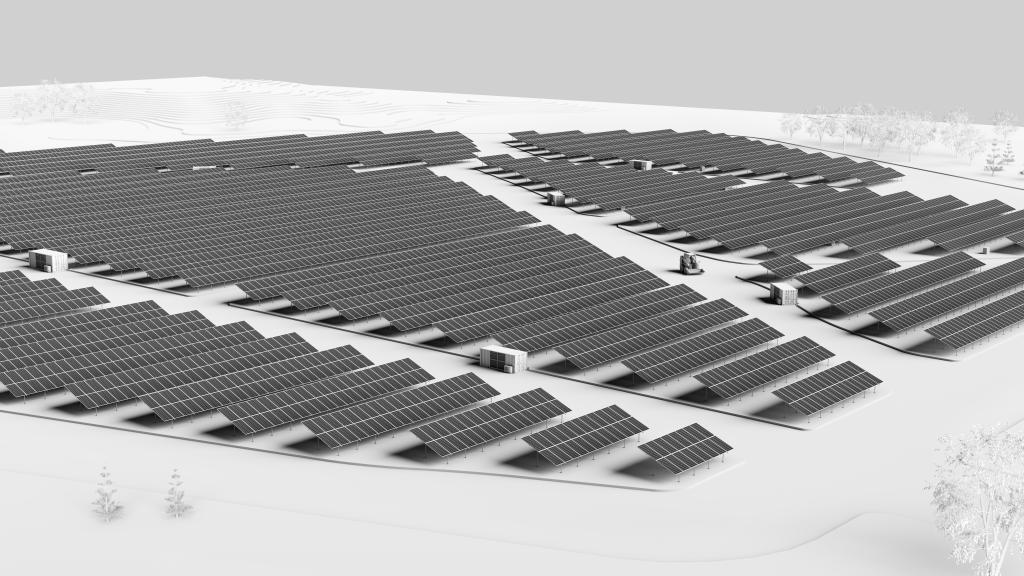
Now – let’s look at a real example of how a virtual PPA works in practice. Please note that the example is based on a standalone solar park in the south of Sweden (electricity bidding area SE4). Parks placed in other geographical regions will look different.

vPPA value for 18 MW solar park in Sweden (SE4), 15 years contract

Solar PPA PriceComparisonSavings

Solar PPA Price

Spot price, adjusted for capture premium

Cumulative savings

Breaking down the numbers

32 öre/kWh

Fixed solar PPA price throughout the contract duration, 15 years.

If you want to optimize day one savings, you can replace the fixed solar PPA price with a price based on a step function. This lets you pay less than 32 öre/kWh during an initial period, and then more during the remainder of the contract period. The average price will still be 32 öre/kWh.

33MSEK

The potential savings over the full contract length (15 years) is 33MSEK.

30MSEK of the 33MSEK is from the energy sold to the grid. This is based on an NPV with 5% WACC.

3.05MSEK of the 33MSEK is what you save on Guarantees of Origin (GOs), assuming an average retail price of 1.5 öre/kWh per year over the total contract period. With a park producing GOs, you can simply buy less of these from other sources.

19.8GWh/year

This includes a 0.2% performance degradation YoY.

Capture price

It’s important to remember that the daily average spot price isn’t representative for the average spot price while the sun is shining. The vPPA in this example is structured “as generated”, meaning the customer gets the full benefit of the capture premium of higher mid-day prices.

Example: Hourly spot prices compared to the vPPA price in SE4, August 21 2020

The average spot price between 06:00 and 18:00 - when the solar park produced energy this day - was 66,5 öre/kWh.

Solar PPA PriceComparison

Solar PPA Price

Spot price, adjusted for capture premium

39.5kSEK

  • Total revenue Aug 21st: 39.5kSEK
  • From PPA: 38kSEK
  • Additional savings from GOs: 1.5kSEK
  • Assumes a solar park located in SE4 with annual production of 19 GWh (18MW)
  • PPA price at 32 öre/kWh
  • Guarantees of Origin priced at 1,5 öre/kWh
Time01234567891011121314151617181920212223
Solar power produced (MWh)00000023691214141313842000000
Difference between PPA price and spot price (öre/kWh)3-3-7-8-10-82231424442404037333233182113111196
Cashflow from PPA (kSEK)000000013456654310000000